Forecast Investigator
The Forecast Investigator helps you answer questions about the demand forecast or use it as the first step to review decisions.
This process helps you understand trends, patterns, and some of the factors that impact demand forecasts in G3 RMS. You can't analyze all the factors and at the same level of complexity as how the system calculates the unconstrained forecast. If you question the forecast for some dates or see an overall forecast issue,
What Help Do You Need with Investigating the Forecast?
- Show me the steps to interact with the Investigator.
- I want to learn about the process or the best practices to review forecasts and decisions.
- I want to investigate the overall forecasts patterns and trends.
- I want to compare actual versus expected on books for a date.
- Show me the data details for the graphs and tables on the Forecast Investigator.
- Show me scenarios of how to use the Forecast Investigator.
- For my Limited Data Build property, I want to understand if business patterns are normal.
- I have reviewed the forecast, and now I want to investigate price.
Investigation Steps
-
Click
 and then Investigator.
 -
The default selection is Pricing. Click the drop down and select to investigate my Forecast.
- By default, all Forecast Groups, Room Classes, and days of the week display. Change the filters to drill down.
- For a specific Room Class, switch between Booked and Stayed data. Review a scenario or learn more about Booked and Stayed data.
- If needed, click Export
 to save the results to an Excel spreadsheet.
Note: use this option to see ADR data (available only for Stayed data). - Click
 to Compare Periods side by side.
For example, compare business for this year’s April against April of the past two years.
- For the current period, enter the Analysis Start Date and Analysis End Date.
- Enter the start dates for up to two Comparison periods. They have the same duration as the Analysis period.
- Click Apply. The chart displays the defined periods, separated by a blue dotted line.
- Click
 to remove the comparison and see all data.
Interacting with the Graphs
- Point to a line to see numerical values.
- To view a period in more detail, click and drag over that area of the chart. Click Reset zoom to reset the view.
- Click an item in the legend to hide the item from the chart. Click it again to restore it.
 Review the graph details
Process to Review Forecast and Decisions
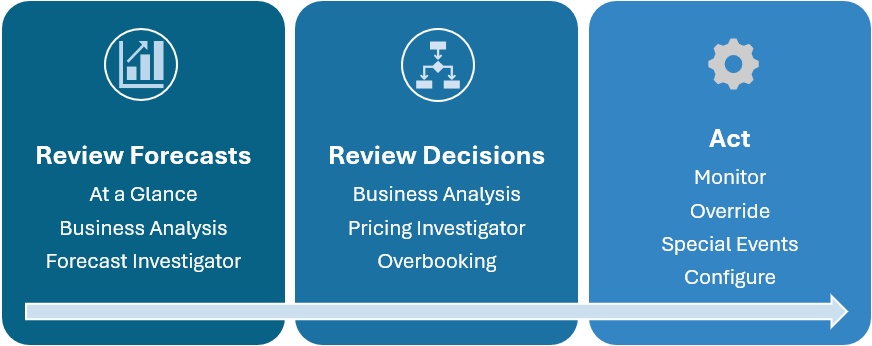
Use the following process when you review the forecast and decisions:
-
On the At a Glance Dashboard, review high-level information:
-
Check the calendar for dates when the forecast doesn't align with what you know
-
Use the heat map to check the day of week demand pattern. Are there any outliers that you need to investigate? These might be indicators of Special Events that you need to share.
-
If needed, click a date to review past performance, price, and other decisions.
-
Below the calendar, use the Summary table to check your expectations of key metrics for the whole month. Compare to relevant past performance, for example, same time last year (STYL).
-
-
On the Business Analysis Data Details page, drill down to review the business mix.
- Review the Occupancy Forecast at the Group and Transient level.
- Compare On Books against remaining demand and against the same time in previous years.
- When your forecast expectations don't align with the system's, view the transient data by Forecast Group. Focus on your largest Forecast Groups.
Note the limitations about reviewing at market segment level.
-
Use the Forecast Investigator to help you understand patterns and trends.
Comparing the forecast and pace to previous years might be misleading because G3 RMS weighs whether to use recent past or previous years for its forecast. The Investigator can help you determine if the system favors recent or distant past. See this scenario.
-
Use the Business Analysis Summary to review Pricing, LRV, and Overbooking by month.
-
The Pricing Investigator helps you to see what impacts the price like demand, LRV, competitors, etc.
-
Review the Overbooking page to investigate Wash, individual groups, or configuration.
-
Continue to monitor, override, add Special Events, or change your configuration.
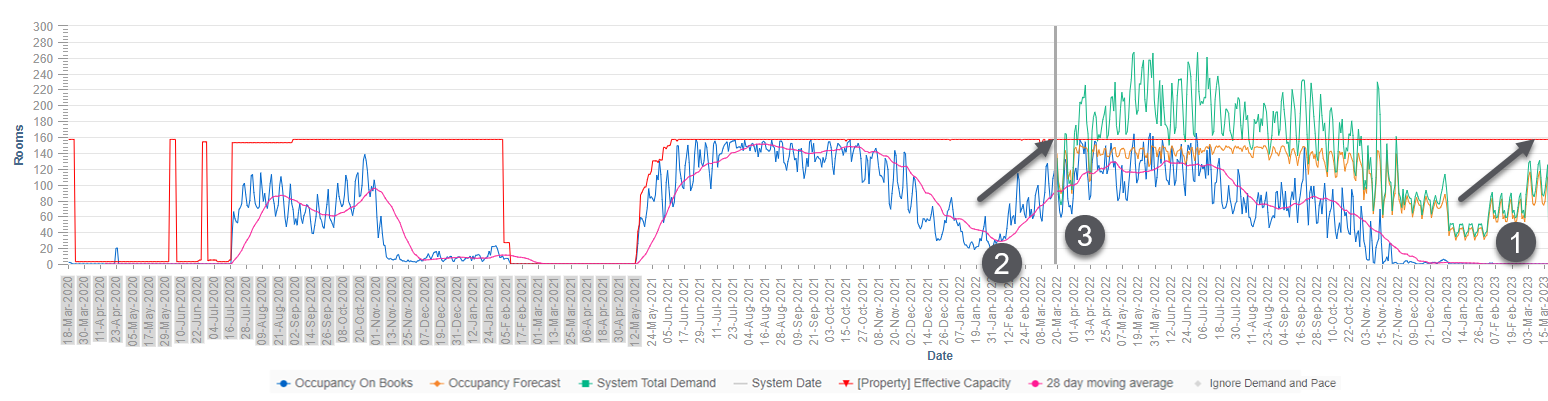
Investigate Forecast Patterns and Trends
Use the Investigator to understand the patterns and trends in the historical data that impact the forecast. It can help with questions like:
- What seasonal and day of week patterns exist?
- Does G3 RMS use the trends from recent or more distant past to forecast?
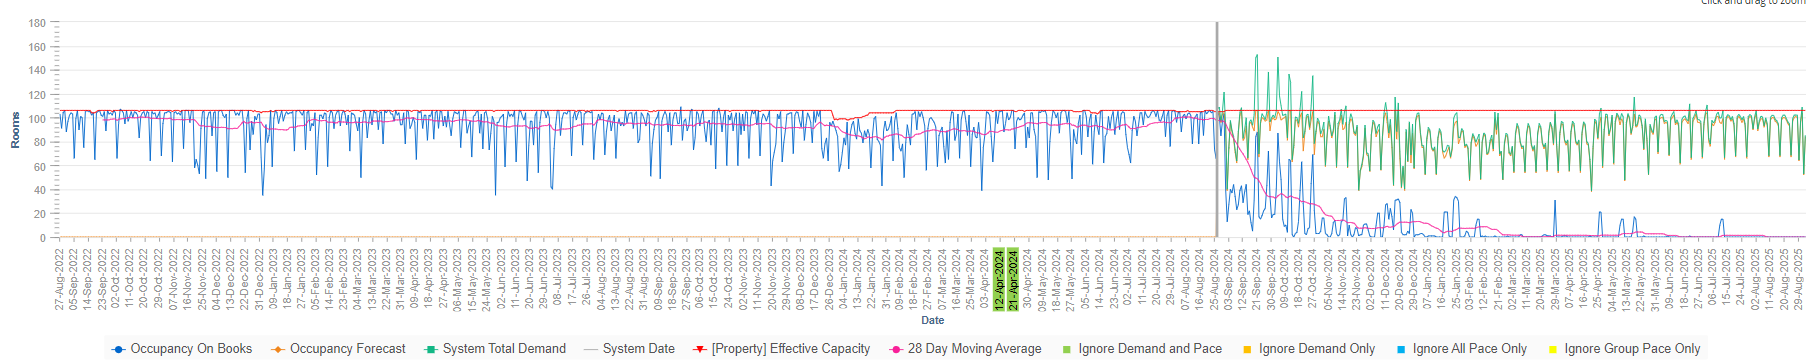
G3 RMS uses past occupancy data by Forecast Group and Room Class to understand how much unconstrained demand existed. And the system uses that historical demand in its demand calculation, see this video for details. Use the graph to:
G3 RMS collects your property's demand history to calculate unconstrained demand by Forecast Group and Room Class. Then the system uses that data to forecast future unconstrained demand. Use the graph to:
- Look for trends in the Occupancy On Books (blue line) of the past and compare this to the future System Total Demand (green line).
- Look for dramatic increases or decreases and ask questions about what the cause might be.
For example, an occupancy drop might be due to a higher price (visible in the ADR of the Excel export). - Begin with All Forecast Groups and All Room Classes.l. Then drill down to Forecast Groups. Focus on the larger ones that make up the majority of your business and are likely to impact the overall property trends.
- Look for unusual trends for a specific Forecast Group, making sure you know the included market segments and their attributes. Are individual market segments causing the unusual trends?
- If needed, check if the trends vary by Room Class. If available, switch and compare Booked and Stayed data to see upgrade patterns. If you are unsure if G3 RMS uses Booked or Stayed data, click Important Information
 .
.
Review the scenarios for detailed examples.
On the date that you set for when patterns are normal, G3 RMS starts using Actuals![]() The occupancy, revenue or ADR that the property achieved, once the day is in the past. Actual occupancy is also called Final Rooms Sold. to forecast demand. Ensure that date is correct by checking that the following patterns match your expectations for business going forward. Start at the property level, then drill down to your biggest Forecast Groups:
The occupancy, revenue or ADR that the property achieved, once the day is in the past. Actual occupancy is also called Final Rooms Sold. to forecast demand. Ensure that date is correct by checking that the following patterns match your expectations for business going forward. Start at the property level, then drill down to your biggest Forecast Groups:
-
Volume of business: Is the Occupancy On Books since opening date still increasing or is it consistent?
-
Business mix: compare the volumes of your biggest Forecast Groups against the property level - is their share as expected?.
-
Pace: Is the Occupancy On Books for one week, two weeks, etc. after the selected date what you expect?
-
Day of week patterns: are the occupancy patterns consistent?
-
ADR: export
the data to review. For example, are introductory discounted offers impacting the ADR?
Investigate Actual versus Expected On Books
Use this section to compare how many bookings G3 RMS expected against what actually booked. For example, for arrival on next Monday, the system expected yesterday that 100 rooms would be On Books today, with an uncertainty range of 10 rooms higher or lower. Today, the Actual On Books is 95.
This data helps you investigate dates when Occupancy On Books changed significantly. You can compare your forecast expectations against the system’s since yesterday. The larger the discrepancy between expected and actual On Books, the likelier that G3 RMS changed the forecast.

Data Details
| Step | Description |
|---|---|
| Rooms | Shows the Occupancy On Books, Occupancy Forecast, and System Total Demand in number of rooms. |
| Date | The dates for which data is available, up to two years for the past and one year into the future. |
| Occupancy On Books | The number of rooms sold as of the current System Date. For past dates it refers to the actual achieved occupancy. |
| Occupancy Forecast | The number of rooms that G3 RMS expects the property to achieve. |
| System Total Demand | The number of rooms on books plus the system unconstrained remaining demand. |
| System Date | Shows as a vertical line and is the date of the last processing. If your system is up to date, it equals today. |
| Effective Capacity | The physical capacity minus out of order rooms. |
| 28 Day Moving Average | The average of the Occupancy On Books for the 28 days before the selected date. This value helps you detect trends because it smooths out very high or low variation on single days. |
|
Ignore Demand Only Ignore All Pace Only Ignore Group Pace Only |
G3 RMS normally uses your historical demand and booking pace to forecast normal demand. Past dates for which the system ignores the data (all, or just group pace, demand, or both) are highlighted in color. For example, the dates of an ignored out of order period display in blue to show that G3 RMS excludes the demand and pace data. Some data might be excluded due to COVID-19 impact. Note: Special Events are ignored but are not highlighted. |
| LDB Projections |
If your property uses a Limited Data Build (LDB), you can view and export the projected rooms. You can view the projections only at the All Room Class level Compare the LDB Projections against Occupancy On Books and Occupancy Forecast. That helps you decide if you need to change your projections. |
The data includes market segments attributed as Unqualified and Qualified Non-block (excluding those with a Forecast Type Attributes of None).
| Item | Description |
|---|---|
| Actual On Books | The occupancy in number of rooms as of the System Date. |
| Expected On Books |
The occupancy in number of rooms that G3 RMS expected for the arrival date, as of the day before the system date. |
| Lowest and Highest Expected | Defines the top and bottom of the uncertainty range. In all forecasts, G3 RMS considers that future demand is uncertain. For example, far into the future uncertainty is likely higher than for dates in the near future. |
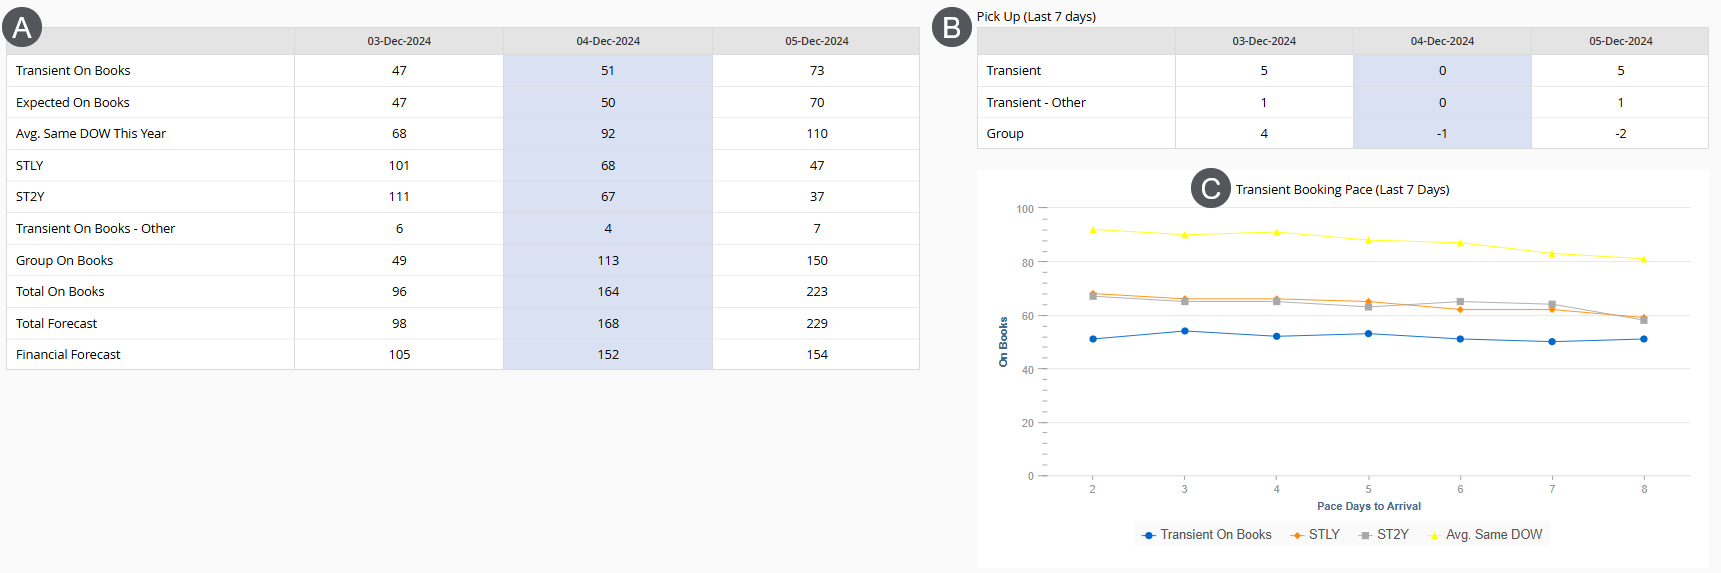
The Transient Booking Pace (Last 7 Days) graph shows how the number of Transient On Books rooms changed for the selected date in the last seven days.
![]()
| Item | Description |
|---|---|
| Transient On Books | The number of rooms that are sold as of the System Date. Applies to market segments attributed as Unqualified and Qualified Non-block (excluding those with a Forecast Type Attributes of None). |
| STLY | The number of rooms on books for the same date last year, adjusted by day of week and as of the same number of days to arrival. |
| ST2Y | The number of rooms on books for the same date two years ago, adjusted by day of week and as of the same number of days to arrival. |
| Avg. Same DOW This Year |
The average number of rooms that are sold for the same day of the week (DOW) in the four weeks before the system date For example, today is Monday April 1 and the selected date is April 10. This value looks at the average sold 10 days out for the four Mondays before April 1. Applies to market segments attributed as Unqualified and Qualified Non-block (except those with a Forecast Type Attributes of None). |
The table on the left displays values for the selected arrival date and for the preceding and following date.
| Item | Description |
|---|---|
| Transient On Books | The number of rooms that are sold as of the System Date. Applies to market segments attributed as Unqualified and Qualified Non-block (excluding those with a Forecast Type Attributes of None). |
| Expected On Books | The number of rooms that G3 RMS expected to be sold based on yesterday's On Books. Applies to market segments attributed as Unqualified and Qualified Non-block (except those with a Forecast Type Attribute of None). |
| Avg. Same DOW This Year |
The average number of rooms that are sold for the same day of the week (DOW) in the four weeks before the system date For example, today is Monday April 1 and the selected date is April 10. This value looks at the average sold 10 days out for the four Mondays before April 1. Applies to market segments attributed as Unqualified and Qualified Non-block (except those with a Forecast Type Attributes of None). |
| STLY | The number of rooms on books for the same date last year, adjusted by day of week and as of the same number of days to arrival. |
| ST2Y | The number of rooms on books for the same date two years ago, adjusted by day of week and as of the same number of days to arrival. |
| Transient On Books - Other | The number of rooms that are sold as of the System Date. Applies to market segments attributed as Transient Block and those Unqualified and Qualified Non-block market segments with a Forecast Type Attribute of None. |
| Group On Books | The number of rooms that are sold as of the System Date. Applies to market segments attributed as Group. |
| Total On Books | The number of rooms that are sold as of the System Date for all market segments. See Data Level Differences if you notice discrepancies. |
| Total Forecast | The Occupancy Forecast |
| Pace Days to Arrival (graph only) | The booking days prior to today. 2 represents booked as of yesterday and equals the Transient On Books value in the blue column (the selected arrival date). |
| Item | Description |
|---|---|
| Transient | The number of rooms sold in the last seven days for the selected date. Applies to market segments attributed as Unqualified and Qualified Non-block (except those with a Forecast Type Attributes of None). |
| Transient - Other | The number of rooms sold in the last seven days for the selected date. Applies to market segments attributed as Transient Block and those Unqualified and Qualified Non-block market segments with a Forecast Type Attribute of None. |
| Group | The number of rooms sold in the last seven days for the selected date. Applies to market segments attributed as Group. |
Best Practices
Review the System's Decisions
If you agree with the system's decisions, but disagree with the forecast, consider first if it's worth investigating the date. If you disagree with the system's forecast, but you aren't certain that you know something that G3 RMS doesn't, continue to monitor it. If you're certain that you know something that G3 RMS doesn't know, apply demand overrides.
Consider the Impact of Demand360
If you subscribe to G3 RMS powered by Demand360, consider that the data from Demand360 can influence the forecast. As a simplified example, unusually high transient bookings for the competitive set will tend to adjust the demand forecast upwards, and the opposite downwards. Changes to demand may then impact decisions.
Don't Review Occupancy Forecast at the Market Segment Level
We do not recommend reviewing the Occupancy Forecast at the Market Segment level because G3 RMS calculates the unconstrained demand forecast at the Forecast Group and Room Class level, not at the Market Segment level. For the constrained Occupancy Forecast, G3 RMS distributes the Forecast Group level data down to the Market Segment level. This distribution is based on historical data and the proportion at which the business materialized under individual Market Segments in the Forecast Group. If G3 RMS does not see past or future bookings for a market segment, G3 RMS considers the market segment discontinued and will no longer produce a forecast for it. For past bookings, G3 RMS looks at the historical period for which it initially received data, typically two years.
Scenarios
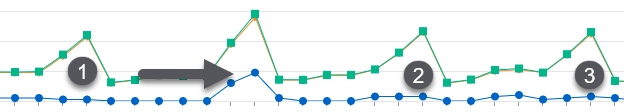
Investigator helps you understand the basic principles behind G3 RMS forecasting: look for consistent patterns in the past and apply them to the future. Here are some examples.
In this example captured in March 2022, look at the forecast for the first quarter of 2023 (number 1). There are no On Books and the matching 2021 season is grayed out and excluded. Therefore, G3 RMS uses the demand level and trend from the same season in 2022 (number 2). Lowest in January, increasing in February and in March (arrows).
To keep it simple we only show the property level, but always verify at Forecast Group level! The patterns might look very different at the Forecast Group level, see the Day of Week Patterns example.
Recent Trends versus Similar Period in the Past
This example also shows how past seasonal trends might not be representative of current demand or the past data is excluded. In this case, due to COVID-19, the system might rely more on recent demand trends. Look at the forecast for April 2022 (number 3). The matching historical data, April 2021 and 2020, is excluded. Recent On Books is trending upwards since early February 2022 (number 2 and arrow). G3 RMS follows that trend and expects strong demand in April 2022, with many dates with unconstrained demand above capacity.
In this example we zoomed in to see the day of week pattern. At the property level the occupancy increases from the low on Sunday, slight decreases for Wednesday and Thursday and peaks on Friday and Saturday.
But G3 RMS forecasts at the Forecast Group (and Room Class) level, and at that level you see differences. For example, for a corporate Forecast Group, demand is highest on the Tuesday, then decreases.
These examples are for a period that is almost a year into the future. With no or very little On Books (1, 2, and 3) the patterns look very similar for multiple weeks. Where more On Books exist (arrow), the system varies the forecasts. And if On Books are stronger than the system expected, it might interpret that as stronger demand and increase the forecast.
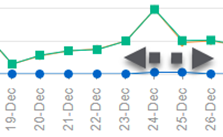
Patterns can vary for repeat Special Events because G3 RMS uses the patterns of the last occurrence to forecast the next one. In this holiday example, December 21 to 25 is set up as a four-day Special Event. The following shows last year's occurrence when December 24, a Saturday, had higher demand than the other three days.
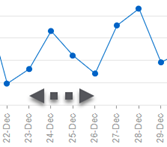
In the next, upcoming year, visual the green line shows that G3 RMS forecasts the same strong demand for December 24. But this year that date falls on a Friday and the demand for Saturday, December 25, might follow the normal day-of-week patterns and be stronger. If so, adjust the Special Event or override demand.
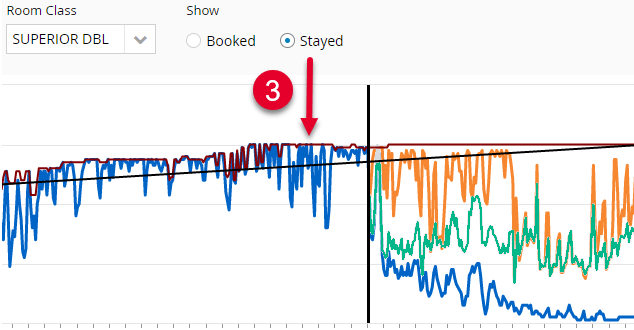
Look at the below scenario, step one. You might ask why the orange Occupancy Forecast for this Room Class is so high, close to capacity. And why the green System Total Demand is below the Occupancy Forecast. Step 2 shows that in the past, Demand for that Room Class was well below capacity.
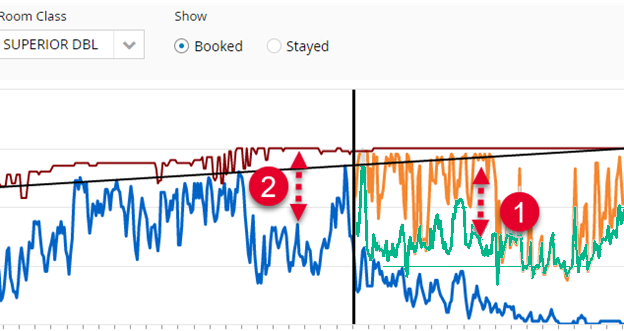
To explain, we switch from Booked to Stayed. In step 3 we see that final Occupancy On Books for this Room Class was usually close to capacity. This is due to upgrades, enabled by Room Type Overbooking and the Upgrade Path. The difference between System Total Demand and Occupancy Forecast is because G3 RMS expects upgrades in the future too.